Your Power Meter is Still the Best Wind Tunnel Available
Your Power Meter is Still the Best Wind Tunnel Available
If you have a power meter mounted on your bike, you already own a mobile and accurate wind tunnel.
I enjoy watching the latest YouTube videos from pro triathletes and cyclists like Lionel Sanders and Alex Dowsett publishing their wind tunnel tests in the endless quest for “free speed”. Fortunately, for those of us that don’t have easy access to a wind tunnel, there’s a way to do aero testing at home that is arguably even more accurate than the wind tunnel and is “free”.
If you are looking to save time and gain speed without training any harder, you’ll want to make sure you have a power meter on your bike and keep reading…
Get a Proper Bike Fitting First
If you know Fit Werx, you know fitting comes first. It is always worth reminding everyone that field testing is not the time to move your saddle around or slam your aerobars as low as they can go. Seek out a bike fitting from a reputable bike fitter who understands aero fitting and cycling biomechanics first so you don’t compromise your power or comfort on the bike with aero testing. Aero testing should only be done to find gains beyond the bike fitting itself. It is not about macro biomechanical changes.
The Chung Method of Aero Testing
I first wrote an article about the Chung Method ten years ago. I still use the same testing practices today. I’ll get into the testing and best practices again in this article, but I want to start by showing everybody that it is not hard to test this way in 2024.
I have used virtual elevation aero testing – better known as the Chung Method for around 15 years and it’s still what I recommend. This method was born on the old internet Wattage groups thanks to Robert Chung. Here’s a link to the original protocol Robert Chung wrote:
https://anonymous.coward.free.fr/wattage/cda/indirect-cda.pdf)
Chung Method Aero Testing Protocol
To test using the Chung Method, you need a circuit/loop course where you can ride continuously without touching your brakes and there are no passing cars. Ride and record this loop at least three times and you’ve done your first test (I’ll explain in more detail later). Once you have recorded these passes, you’re ready to look at the data in Golden Cheetah – which is free shareware.
It is worth noting that, even if you haven’t done specific testing yet, you can upload a recent bike file from a race or training ride to learn how Golden Cheetah works. I’ve found just using the program opens eyes and will get you seeking a proper testing venue.
Within Golden Cheetah there’s a chart you add called “Aerolab Chung Analysis”. Upload the loop ride file you just made and it will look something like this in Aerolab:
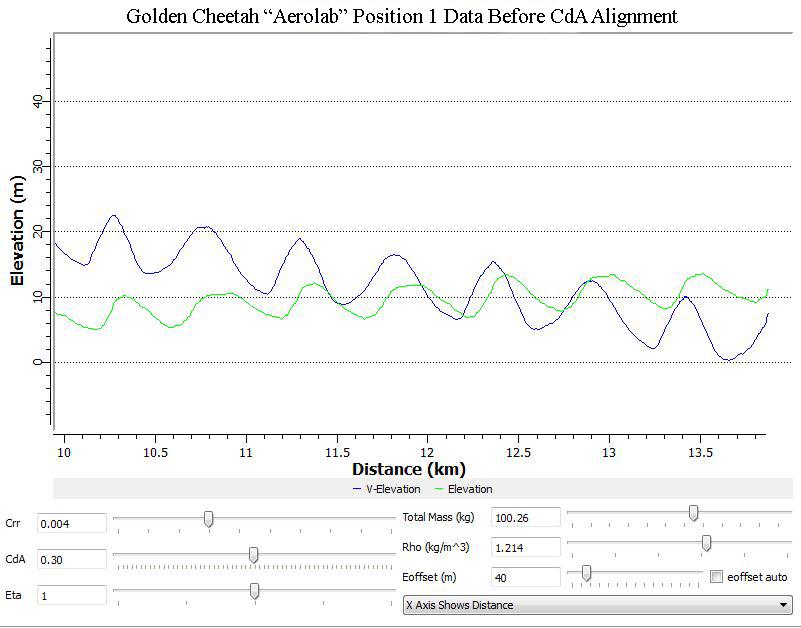
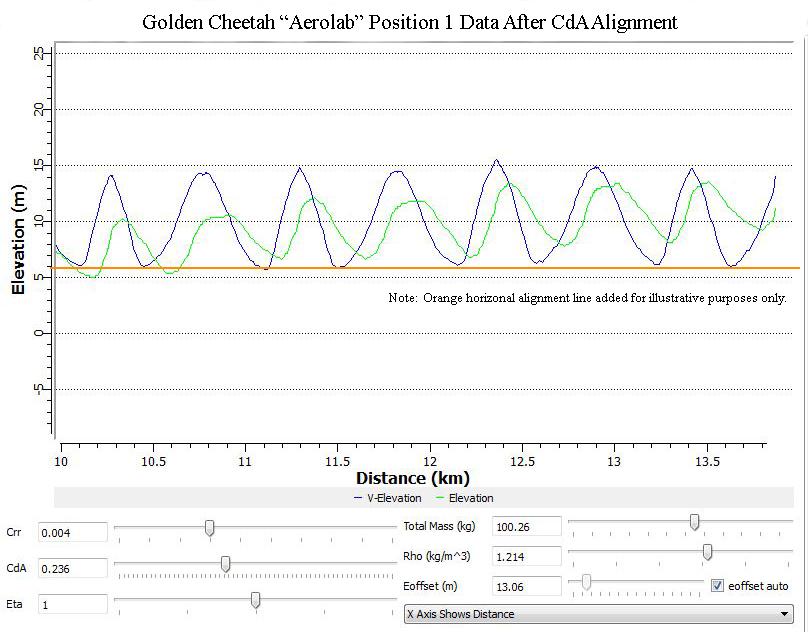
Ignore or remove the green line which is GPS from your bike computer and not important right now. The blue line is computed virtual elevation. You then adjust your CdA slider bar until all the bottom points of your blue line are level (shown below). That’s your CdA value for this run. CdA is your aerodynamic drag coefficient and it is what you’re trying to measure with testing. The lower your CdA the faster you go for a given power output. As you can see in the post CdA Alignment graph below, the CdA value for this setup is 0.236.
A note for those learning the program with a race/training file: If you uploaded a race file into Aerolab, your blue line will look different. For the purpose of learning the process you can still adjust the CdA value until the beginning and end of the blue line are at the same elevation. It will provide your CdA value, but it’s not going to be very accurate. All the braking and traffic you passed during your ride will muddy the waters. However, with a tighter protocol you’ll get better results. This is where a controlled test course comes in.
Other Data Fields to Enter in the Aerolab Chart
Before talking about the actual testing protocol, let’s discuss the other fields you’ll need to fill in the Aerolab Chung Analysis chart to get quality results.
1) “Total Mass” is combined bike and rider weight. Dressed in riding gear, step on your bathroom scale with your bike.
2) “Rho” is air density. This can be found after testing by getting temperature and pressure data during the time of the test session from www.wunderground.com and letting Golden Cheetah’s “Air Density Calculator” (Tools:Air Density Calculator) do the rest.
3) “Crr” is Coefficient of rolling resistance (Crr). If you are not certain of the Crr of your tires, enter a value of 0.004 if you are using race tires or 0.005 for training tires. Rolling resistance will change with ambient temperature, tire wear, and condition of pavement, so pinpointing it exactly can be difficult. However, you need to leave the rolling resistance (Crr) number entered into Golden Cheetah constant between tests if you want to isolate differences in aerodynamic drag (CdA).
Chung Method Aero Testing Protocol
Now that you know the basics of how to use Golden Cheetah software for aero testing, here are the main rules and best practices to become a true Chung tester who gets accurate results from their circuit course:
- Ride at least three repeats of a course around 2-5 minutes in length.
- Don’t touch the brakes.
- Stay in the same position the whole time (such as tucked into the aerobars, head forward, for example).
- There can be no passing cars during the test.
- Pedal at any power output you want and even change power throughout the test. However, it is important to make sure you ride at a speed that allows you to turn without touching the brakes – this is the tricky part.
- Use a wheel speed sensor. GPS is not accurate enough for aero testing on a small course. Many of us only use computer GPS for speed, so seek out a wheel speed sensor that is available for your computer.
I find the biggest challenge to good testing is avoiding passing traffic. Early weekend mornings are best. If you’re not lucky enough to find a remote side road with a dip in it, seek out office parks with wide open parking lots on weekend mornings. Any loop of a few rural roads that doesn’t require braking can work. I have a friend using a paved running track which works like a velodrome, but without the distortion of the slope (more on this later).
The Beauty of the Half-Pipe Course
I briefly referenced the “half-pipe” method of testing, which relies on a quiet road with a dip in it. The half-pipe course is an easy way to cover all the best practices required to get quality results.
What is a half-pipe course? Think of a skateboard half pipe. You find a road with a dip in it meaning you go down a hill on one side then up a hill on the other side. You turn around at the top (remember, no brakes…) and head back to where you started. Repeat the half-pipe circuit a few times and you’re ready to get a CdA value for that setup.
The reason half pipe testing works so well is that the hill allows you to slow down and turn without touching the brakes. The downhill then makes it easy to get back up to a fast speed without much effort. Ideally, you’ll want to reach peak speeds around your race speed, but higher or lower speeds will still work as CdA stays relatively constant across typical cycling speeds. The half-pipe allows you to make a loop course on a tiny section of road.
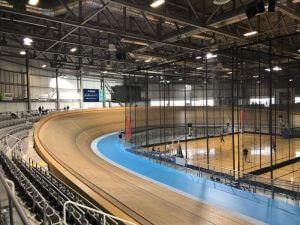
Chung Testing in a Velodrome
Velodromes can work well for the Chung Method as they are consistent. The following shows the raw file where I tested four different setups in a velodrome:
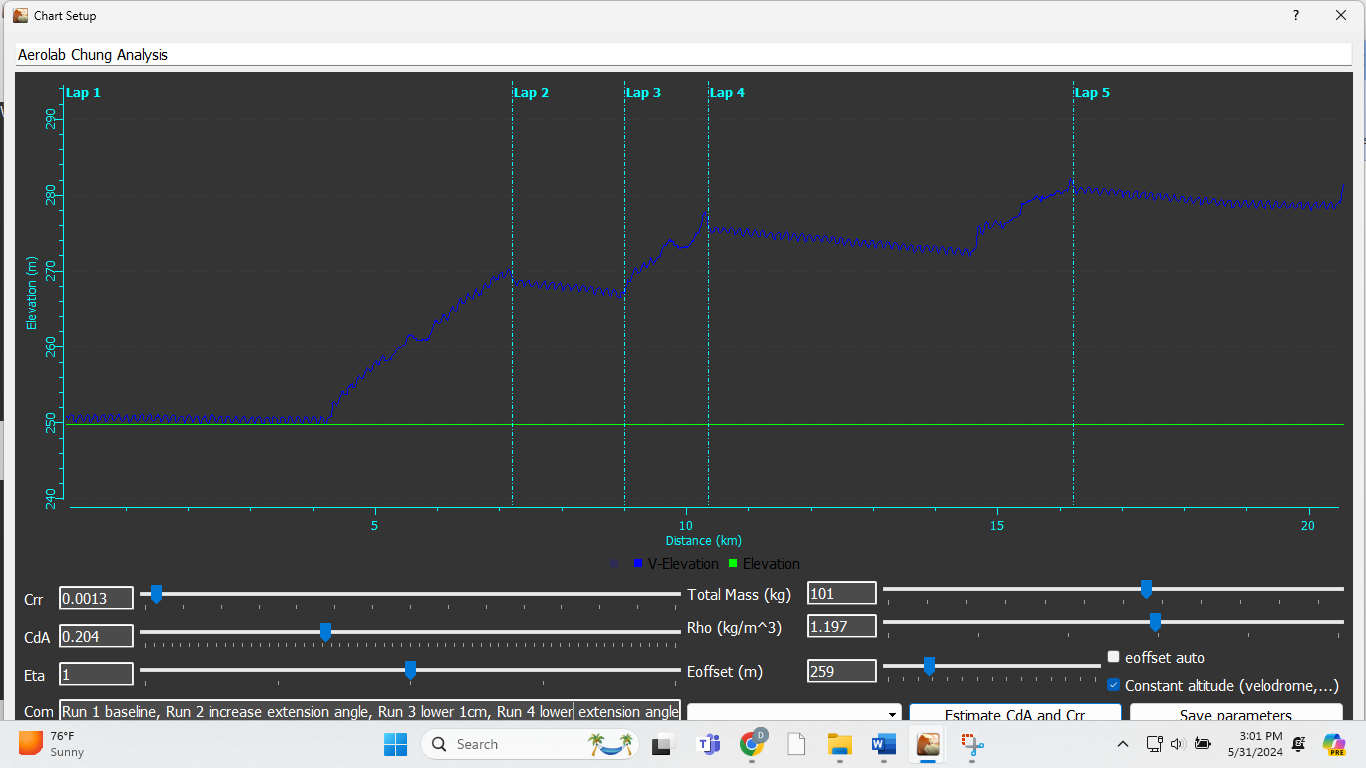
As can be seen above, I’ve lined up the tiny bottom peaks of the first test for a CdA value of 0.204. Right away you can visually see the three subsequent tests to the right all have near horizontal lines that slope downward. Every one of those tiny peaks is the bike rolling into a turn then out of a turn. While Aerolab doesn’t know you’re in a velodrome, it measures the tiny changes in elevation when your bike is leaning over in the turns where it speeds up then back upright on the straights where it slows down. This makes it easy to align a CdA value to the test run since everything is controlled so well.
Here’s what happens to the Aerolab chart when CdA is changed to 0.198 to level the test:
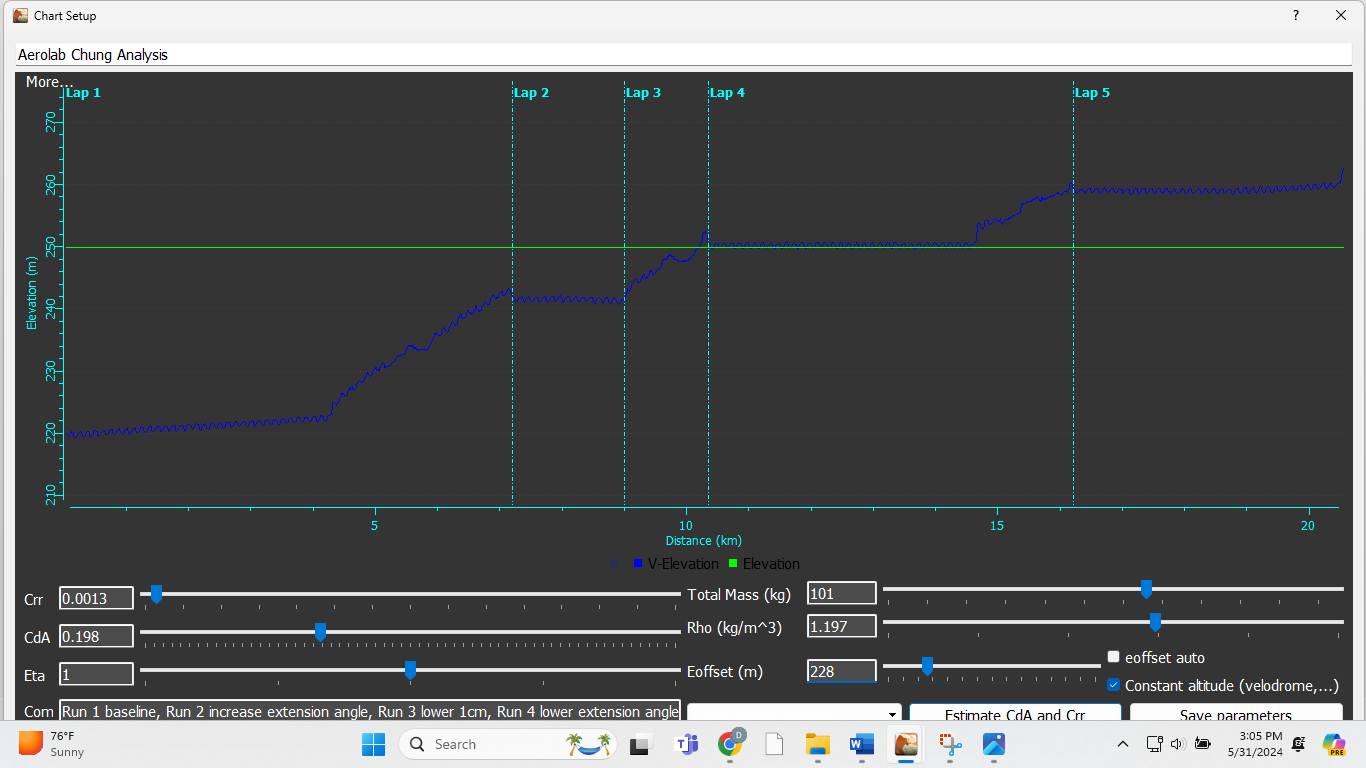
Runs 2, 3, and 4 are now flat and the first run you can see slopes upward. On this particular day, the first position I tested had the highest CdA, then I tried three other aerobar extensions angle changes that all happened to have the same CdA.
I’m a big proponent of aero testing with your power meter in the field since you can do it many times and it gives you real world accurate CdA values when done correctly. This being said, I do enjoy wind tunnel testing and velodrome testing when the opportunity is there. It is just important to realize that velodrome testing and wind tunnel testing have some downsides compared to the real world that are often overlooked.
Downsides of Velodrome Aero Testing
While I love aero testing in velodromes, it has shortcomings. These include the following:
- Not all of us have access to a velodrome, and it can be challenging and costly to get time alone to test.
- All virtual elevation testing requires an accurate wheel speed sensor.
- It’s easy to measure a tire rollout using a tape measure, but let’s remember that there is effectively variability in tire circumference when riding on the sloped surface of a velodrome.
Track riders are all familiar with the fact that your tire doesn’t wear evenly, in fact it wears heavily on the right side (up track). On the straights, track surface slopes down to your left and you are actually riding on the right side of your tire. Then, when riding at faster speeds through a sloped turn your bike will lean until you’re riding on the center of your tire. The center of your tire has a larger circumference than the right side.
To complicate things even more, there are really fast speeds where you and your bike lean inward, on the left side of your tire.
The bottom line is that your wheel circumference is not remaining constant in a velodrome and that means your sensor data is also more variable.
When comparing measured wheel speed to actual lap splits of the 250 meter track it doesn’t match and the difference can change with speed.
All this noted, as long as you test within a small speed range, perhaps close to race speed, you’ll still get repeatable results. Speaking of leaning in velodrome turns, this gets into the other challenge measuring what speed you’re actually going…
- The black line around the bottom of the velodrome is a 250 meter lap. You’ll hear this repeated watching hour record attempts on TV. Because the turns on a velodrome are sloped, the rider’s wheels are going 250 meters each lap, but their body is now taking a shortcut. This tends to reduce their CdA value slightly.
This is an oft overlooked reason why track bikes are said to have lower CdA values than road bikes. It’s not just from removing a couple derailleurs and a cassette. This isn’t really an issue as much as it’s a difference between velodrome and real-world testing that should be noted.
Despite these little nuances, velodromes are still excellent testing venues as they are controlled and free of traffic and other impediments.
Downside of Wind Tunnel Aero Testing
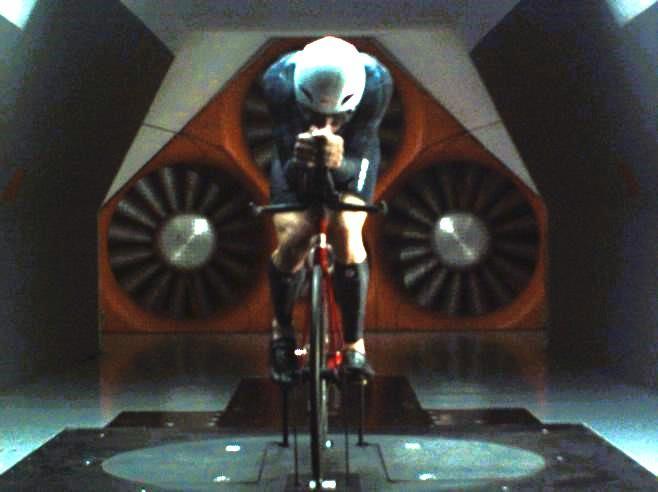
We can’t pick on velodrome testing without also pointing out the shortcomings of wind tunnel testing.
While a wind tunnel provides many testing opportunities and ways of looking at results (precise yaw angles, etc.) that can only be controlled in this setting, it has arguably the biggest shortcoming of all testing methods – the bike is fixed in place.
There’s a very different dynamic going on in real life with the bike and rider moving than in a wind tunnel. The next time you watch a time trial in the Tour de France or the bike leg of Ironman Kona, pay attention to how much the bikes move under the riders. We now get great up-close videos behind riders, in front of riders coming toward us, on all kinds of terrain such as fast flats, up hills, or finishing surges. See how the front and rear wheels move side to side with respect to each other every pedal stroke? The rider also moves more with the bike than they can move when it’s fixed in a wind tunnel, but it’s natural free movement. It’s as if the bike is constantly moving between -2 and +2deg yaw angles every pedal stroke. This movement currently can’t be replicated in a wind tunnel.
Wind tunnels will still give you solid data that usually correlates well with real world CdA changes. However, when it comes down to really hunting those marginal gains, I want to be testing my bike with all the real-world movement to make sure any improvements I find are actually real.
Ironically these very small 0.001-002 CdA changes tend to be what elites are looking for in the wind tunnel. It wouldn’t surprise me if a particular hydration set-up, calf sleeve, or helmet tests one way when the bike is still in a wind tunnel, but leans the other way when everything is moving side to side each pedals stroke. A significant advantage goes to the Chung Method in this area.
Now that you know you have an aero testing tool on your bike already that is better than a wind tunnel or velodrome, it’s time to get out there and start testing and learning! Enjoy finding new “free” speed!