Your Power Meter is the Best Wind Tunnel Available
By Dean Phillips, Lead Fitter and Co-owner of Fit Werx²
If you have a power meter mounted on your bike, you already own a mobile and accurate wind tunnel. Aerodynamic drag field testing is easier than ever to perform. When executed properly, field testing can actually be more functional and useful than wind tunnel testing as it takes the human mechanics of riding into account and can be repeated over and over again. In this article, we’ll explore how to get started with aerodynamic field testing. If you are looking to save time and gain speed without training any harder, you’ll want to keep reading…
While seeking a faster aerodynamic position via field testing can be fun and rewarding, it is important to note that it is important that you have a proper bike fitting before you start testing. A qualified bike fitter, who has intimate experience with aero positioning, can adjust you to a position that is comfortable, powerful, and aerodynamic and you need this baseline or it is easy to get lost in the numbers. While trying to make a position more aerodynamic, you can do more harm than good by adjusting fundamental saddle and aerobar positioning variables. Field testing should only be used for minor changes in position and equipment; only items that do not affect the sustainability or efficiency of your position should be tested. A common list of options that can be field tested well includes aero helmets, head positions, aerobar tilt, armpad width, and aerobar drop (within the rider’s biomechanically functional range) and a host of wheels, componentry and frames.
I have spent hundreds of hours field testing different positions and pieces of equipment and have used a variety of methods. My venture into power meter based aerodynamic testing started out as curiosity, but quickly turned into an addiction in the pursuit of “free speed”. For years I used a method developed by Dr. Jim Martin. This method involves finding a flat stretch of road and riding back and forth at a wide range of speeds while controlling a number of variables. The rates at which aerodynamic drag and rolling resistance vary allow the CdA (aerodynamic drag coefficient) and Crr (rolling resistance coefficient) to be extracted from the power meter data for comparison across different positions and equipment. This method was very effective, when done correctly, and it was a big part of my TT speed increasing about 3 mph over the course of a couple seasons (without any notable change in fitness).
More recently, I have been using the “Chung Method” (developed by Robert Chung) of virtual elevation field testing and it is the simplest, quickest and most effective method I’ve found yet for testing aerodynamic drag (CdA) at home. I won’t get into the details (they are outlined at https://anonymous.coward.free.fr/wattage/cda/indirect-cda.pdf), but the “Chung Method” allows for several changes to be tested in less than 30 minutes with great accuracy. Here is how to get started using the “Chung Method”:
The first step in aerodynamic testing with a power meter is to collect the data on the positions/equipment that you want to test. In terms of data collection, the “half-pipe” method of repeats works really well. To test, you just find a quiet stretch of road with a dip in it and ride down one side of the hill and up the other side, turn around at the top, and repeat a few times for each session. The hill allows you to slow down without touching your brakes or changing your position. The only three rules you need to follow while testing are:
1) Don’t touch the brakes.
2) Stay in the same position the whole time (tucked into the aerobars, head forward, for example).
3) There can be no moving vehicles around you (no drafting, passing or being passed).
Now that we know the rules, let’s explore an actual test session and the data analysis. In this example, I’m testing how a 2cm armpad placement change affects my CdA. I am riding the exact same Cervelo P5 with aero wheels, skinsuit, and aero helmet in both sessions and the only thing that changes between the two sessions is the 2cm adjustment in armpad placement.
First, adhering to our three rules from above, I roll through my sessions. I complete and record a set of repeats in Position 1 on my power meter and then make the armpad adjustment and do the same set of repeats and data recording in Position 2. This is all that actually needs to be done in the field, the rest is crunching the numbers.
Golden Cheetah’s free shareware (https://goldencheetah.org/) works great to analyze data. I download my test session results into Golden Cheetah and open the Position 1 data and then go to “Aerolab Chung Analysis” view (currently located in the “+” pull-down in the upper right). Once in the “Aerolab”, I enter the following variables (you don’t need to enter/change the others to analyze CdA) in the fields:
1) Combined bike and rider weight (“Total Mass”). Dressed in my riding gear, I step on my bathroom scale with my bike to get this.
2) Air density at the time of the test (“Rho”). This can be found after testing by getting temperature and pressure data during the time of the test session from www.wunderground.com and letting Golden Cheetah’s “Air Density Calculator” (Tools:Air Density Calculator) do the rest.
3) Coefficient of rolling resistance (Crr). If you are not certain of the Crr of your tires, enter a value of 0.004 if you are using race tires or 0.005 for training tires. Rolling resistance will change with ambient temperature, tire wear, and condition of pavement, so pinpointing it exactly can be difficult. However, you need to leave the rolling resistance (Crr) number entered into Golden Cheetah constant between tests if you want to isolate differences in aerodynamic drag (CdA).
Once these three variables are entered, you are ready to align and analyze the results in the graph. At this point, you will see that the lowest dip points on the blue line in the data gradually descends in elevation as you go from the first “half-pipe” run on the left to the ones on the right (see image below). You can ignore the green line in the graph altogether.
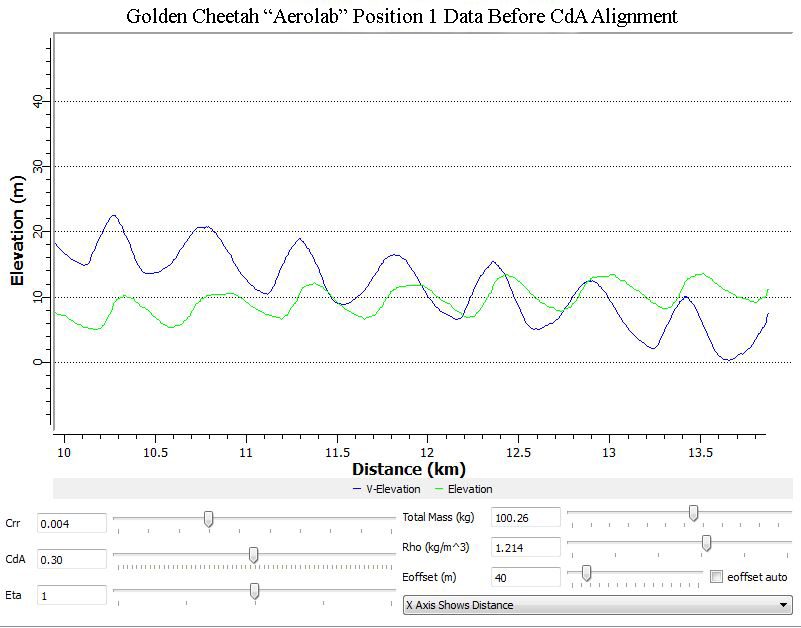
The descending blue line signifies a small difference in CdA. To find out how much the difference is, you adjust the CdA slider bar until the lowest dips of the blue line align along the same horizontal elevation line. It is helpful to note that if you click your mouse on any point of the blue line in the graph it will show you the actual elevation at that point; this makes it easier to compare all the dips until you get them to the most similar elevation possible using the CdA slider. Because the bottom of the hill is always at the same place, even if you turned around in slightly different locations at the top of the hill while collecting data, the data will still align well.
Properly aligned results look like the graph below (note how all the blue valley bottoms are as close as possible to the same elevation at 6m):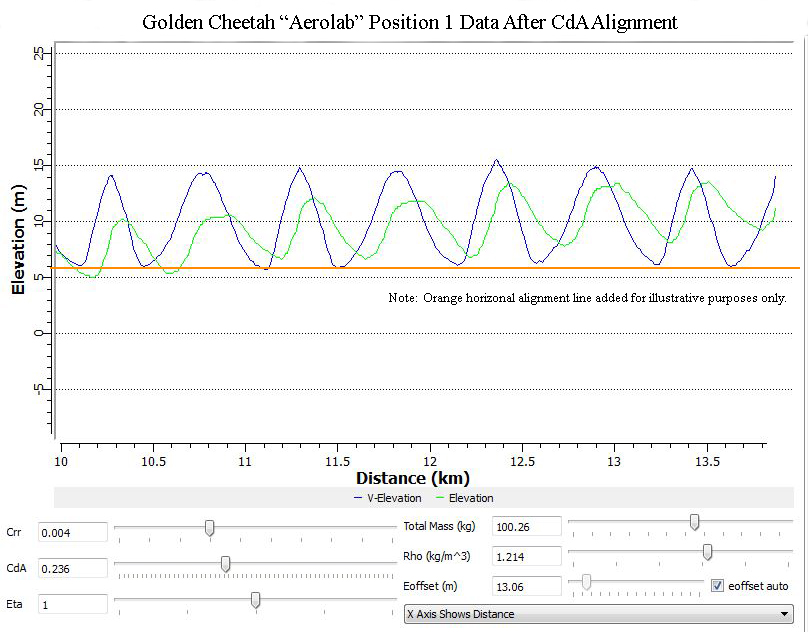 When aligned, you can see that the CdA number no longer reads “0.30”, it now reads “0.236”. This is the aerodynamic drag number for Position 1 – the position before adjusting the aerobar armpads.
Next, I analyze the data from Position 2, after the armpads were adjusted, the same way as I did with Position 1. After I download and open the Position 2 data into the “Aerolab”, I enter all the same data for air density, weight and Crr that I used in Position 1. Again, I use the CdA bar slider to adjust the data until the bottoms of the valleys/dips of the blue line are all at the same height on the graph vertically. You will note that when you make small adjustments in position or equipment it may be difficult to see the small change in elevation – you can see in the image of Position 2 before adjustment below that the descending trend is much less defined than the “Before” image for Position 1. You need to be able to recognize that elevation change is still there though; as mentioned before, use your mouse to compare elevations at each valley. 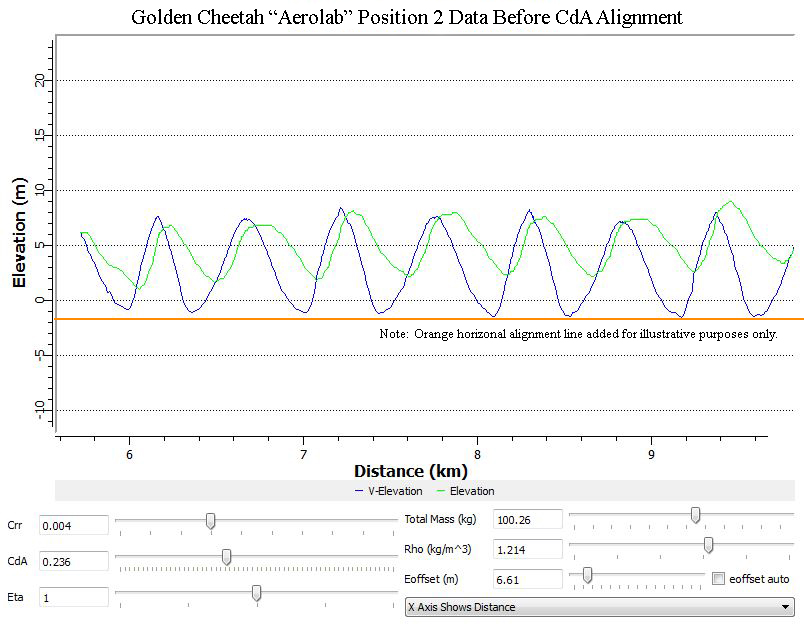 The adjusted/leveled results for Position 2 look as follows:
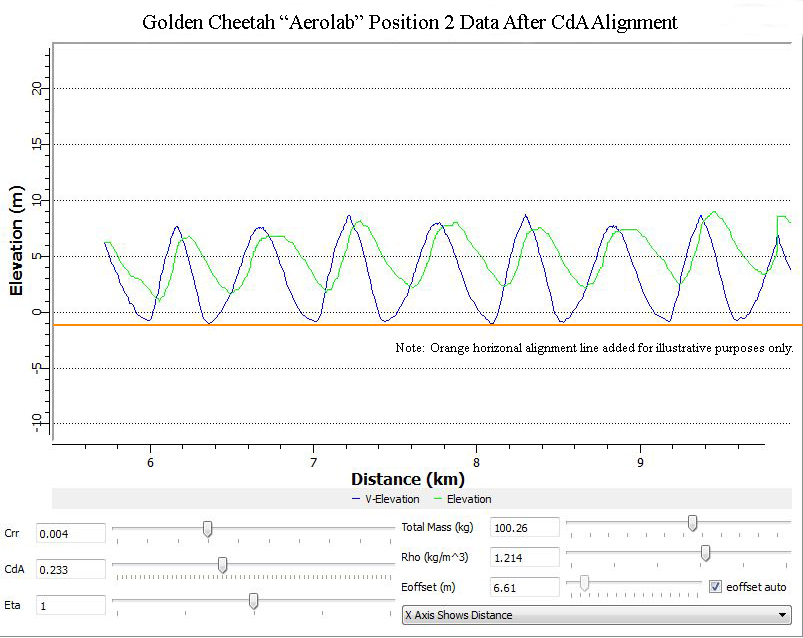
Note that the vertical elevation alignment of the blue line dips need not be the same as what was used in Position 1, the valleys just need to be at the same vertical elevation number within that test group. In this example, the CdA slider aligned the dips best very close to -1m, which results in a CdA number of “0.233” in Golden Cheetah.
The results of both test sessions are thus:
Position 1: CdA = 0.236
Position 2: CdA = 0.233
Lower CdA numbers mean less drag and thus better aerodynamics. In this case, the test showed that the small change to armpad position improved my CdA by 0.003, this equates to about 3 watts (~0.13 mph) at an average riding speed of 20-25mph. No, this is not much, but the reality is that every tenth can count and they do add up. Assuming I can maintain this positioning change comfortably, I just saved over two minutes on my next Ironman. Many riders can find much more substantial savings than this when they first start testing as there is often “low hanging aero fruit” to bite off initially. I can remember one early session where I found over 20 watts just by changing wheels! I shaved 15 minutes off my Ironman time without any extra training in a single aerodynamic field testing session that day.
Virtual elevation field testing using the Chung Method is the best method I’ve found to test aerodynamics and it can be done pretty easily by anybody with a power meter. It just involves finding a good venue, fine-tuning your protocol, and of course a bit of patience. Once you start seeing the benefit of field testing it can become as addicting as riding the bike itself as you will start to find more speed and that is a great reward.
Be sure to visit the power meter section of our Tech Center for more information on power meters and don’t hesitate to call or email if you have questions or to order.